pie chart
US /paɪ tʃɑrt/
・UK /pai tʃɑ:t/
B2 中上級
n.名詞円グラフ
The pie chart clearly showed the distribution of sales across different regions.
動画字幕
IELTSライティングタスク1:棒グラフの記述方法 (IELTS Writing Task 1: How to describe BAR GRAPHS)
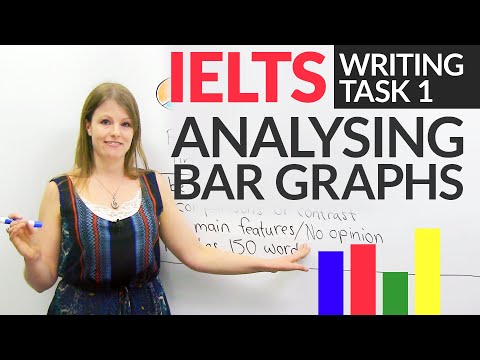
- This is called a pie chart. Okay?
これは円グラフと呼ばれています。いいですか?
- This is called a pie chart, okay?
これについては別の動画で取り上げましたので、興味のある方は
【ビジネス英語】初心者向け実用的な職場の会話

- Should I use a bar chart or a pie chart?
棒グラフと円グラフ、どちらを使えばいいですか?
- Should I use a bar chart or a pie chart?
これでよくわかりました。
【サンリオで英会話】キティの叶わない夢

- Another sale for the old pie chart, Bats!
わあ、ベイクセールはとってもステキね。完ペキな町の募金イベントになりそうだわ。
- Another sale for the old pie chart, Badtz.
昔の円グラフがまた売れたわね、バツ丸。
IELTSライティングアカデミック・タスク1 - 円グラフの描写方法 (IELTS Writing Academic Task 1 - How to Describe a Pie Chart)

- at how to describe you IELTS Academic Task 1 Pie Chart. This is the quick version because
IELTS Academic Task 1 Pie Chartをどのように記述するかで。これがクイックバージョンなのは、以下のような理由からです。
- It might be one, it might be two, depending. If you've got a pie chart and a line graph,
1つかもしれないし、2つかもしれない。円グラフと折れ線グラフがあれば
IELTSアカデミックタスク1:折れ線グラフの描写方法 (How to Describe a Line Graph IELTS Academic Task 1)
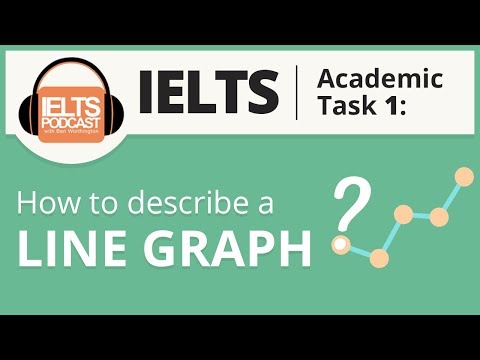
- From the graph, it is clear, as can be seen from the line graph, as is shown by the table, as is illustrated by the pie chart.
私たちが"It is..."文を持っている場合、例えば、次のようになります。
- "As is illustrated by the pie chart..."
"As is illustrated by the pie chart..."
IELTS タスク1 マップ比較 バンド9ライティング (IELTS Task 1 Compare Maps Band 9 Writing)

- in the academic ielts you are expected to write an expository essay in the third person voice for task one based on a line graph, bar chart, pie chart, flowchart diagram, or a map.
アカデミックIELTSでは、折れ線グラフ、棒グラフ、円グラフ、フローチャート図、または地図に基づいたタスクワンのエクスポジトリーエッセイを書くことが期待されます。
- But in the academic IELTS, you're expected to write an expository essay in the third-person voice for task one, based on a line graph, bar chart, pie chart, flow chart, diagram, or a map.
休暇旅行者に対応するために、土地と水の利用の両方が大幅に開発されました。
顧客は常に正しい | ガムボール | カートゥーンネットワークUK (The Customer Is Always Right | Gumball | Cartoon Network UK)

- To illustrate the situation, here's a pie chart.
状況を説明するために、円グラフを見てみよう。
- To illustrate the situation, here's a pie chart.
失礼ですが?
Marques Brownleeはハゲた?! | Tesla Time News 587 (Marques Brownlee Goes Bald?! | Tesla Time News 587)

- Supervised the pie chart describing my favorite bars.
私の好きなバーを説明する円グラフを監視しました。
- The pie chart describing my favorite bars.
すごい。
世界を変えた5つのチャート | BBC Ideas (Five charts that changed the world | BBC Ideas)
- This is a pie chart.
これはパイチャートです。
- This is a pie chart.
これはパイチャートです。
初心者向けパープレキシティ:知っておくべきすべて (Perplexity Computer for Beginners: Everything You Need to Know)

- I want to add each service name and price, see total monthly cost, a yearly projection, a pie chart showing where my money goes.
アイデアを生成するものとして。
- See total monthly cost, a yearly projection, a pie chart showing where my money goes.
月間合計費用、年間予測、そしてお金がどこに使われているかを示す円グラフを表示します。